What is Wireshark?
Wireshark is a free and open-source network protocol analyzer. It is used for troubleshooting, analysis, and educational purposes. Wireshark can capture and display data from a wide variety of network protocols. This data can be used to troubleshoot network problems, analyze network traffic, and learn about network protocols.
You can refer to Wireshark User’s Guide for detailed documentation
About Tshark : Wireshark also provides a powerful command-line utility called TShark for people who prefer to work on the Linux command line. You can use tshark to capture and analyze network packets from command line
How is Wireshark used ?
Wireshark works by capturing network packets as they are transmitted between devices on a network. Wireshark can then display the captured packets in a variety of ways, including a list of all packets captured, a breakdown of each packet’s contents, and a graphical representation of the network traffic.
Essentially packet analysis on wireshark has following steps
Step 1 : Packet Capture
Wireshark allows you to capture the live traffic as well as use previously captured network packets
Note : You can use other tools to capture the network traffic for example you can use tcpdump to capture and create a pcap file, which can then be used for analysis using Wireshark
A *.pcap file is a file format that is used to store captured network packets. Wireshark can be used to open and analyze *.pcap files.
Step 2 : Filtering
A network traffic capture without any filters will contain all packets that were received or sent from your network interface. This can include many unwanted packets that are not relevant to your analysis. Therefore, once you open the capture file in Wireshark or make a live capture, you will need to apply filters to display only the relevant packets. This will reduce the size of the capture and improve the efficiency of your analysis.
Note that you can also capture network traffic and apply filters at the same time. This can reduce the amount of data that needs to be captured and can make your analysis more efficient.
Step 3 : Visualization
Once you have displayed the relevant packets, Wireshark allows you to visualize them in a variety of ways. For example, for VoIP calls, Wireshark provides a predefined filter to display them, as well as the ability to see the call flow and listen to the voice (if RTP packets are also captured).
The default view is a list of all captured packets. This view shows the source and destination IP addresses, the protocol, the length of the packet, and the time that the packet was captured. You can also view the contents of the packet in a hexdump or ASCII format. Wireshark also supports a variety of graphical views, including a timeline view and a network map view.
Going Deeper
Wireshark allows you to go deep into packet analysis. You can see the packets and their information down to the bit level. Depending on your role or the purpose of your analysis, you can choose to go deep or simply stop at the relevant packet to view high-level details and conclude your troubleshooting.
For example, if you are a network administrator, you may want to go deep into packet analysis to troubleshoot a network problem. You can use Wireshark to see the packets that are being sent and received by the devices on your network. This can help you to identify the source of the problem and to fix it.
If you are a security analyst, you may want to go deep into packet analysis to investigate a security threat. You can use Wireshark to see the packets that are being sent and received by the devices on your network. This can help you to identify the threat and to take steps to mitigate it.
When to Use Wireshark
Wireshark can be used in a variety of situations. Some of the most common uses for Wireshark include:
- Troubleshooting network problems: Wireshark can be used to troubleshoot network problems by capturing and analyzing network traffic. This can help you to identify the source of the problem and to find a solution.
- Network analysis: Wireshark can be used to analyze network traffic to gain insights into how your network is used. This can help you to identify security risks and to optimize your network performance.
- Learning about network protocols: Wireshark can be used to learn about network protocols by capturing and analyzing network traffic. This can help you to understand how different protocols work and to troubleshoot problems that are related to network protocols.
However, it is important to remember that packet sniffing can also be used to eavesdrop on network traffic. As such, it is important to use packet sniffing responsibly and only to capture traffic that you are authorized to capture.
Using Wireshark for live packet capture
Wireshark can be used to capture SIP call traces on the system where the calls are being established. It can also be used to troubleshoot any kind of network issue, such as API calls or web requests. By capturing the network traffic, you can see the exact data that is being sent and received. This information can be used to debug problems and to improve the performance of your network.
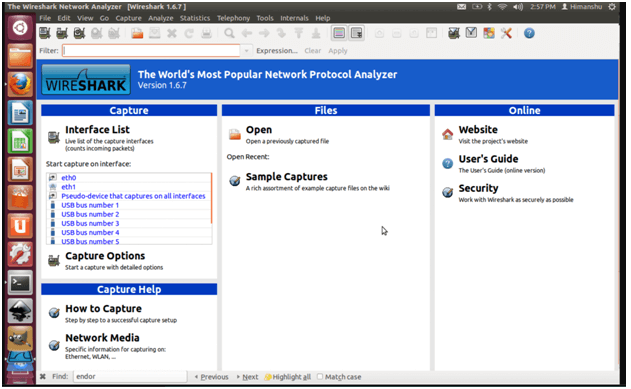
1. Select parameters for packet capture
- Open the Wireshark application
- Specify the filter for the protocol, port, source ip, or destination ip etc for which you want to start the capture
- Select the interface for which you want to start the capture,
- You can also use Promiscuous mode on a network interface where it receives all packets that are transmitted on the physical network segment to which it is connected
Note : You can choose to simply start the capture as well without specifying filters / interfaces, it will mean the amount of packets captured will be large and you will spend more time during the analysis part.
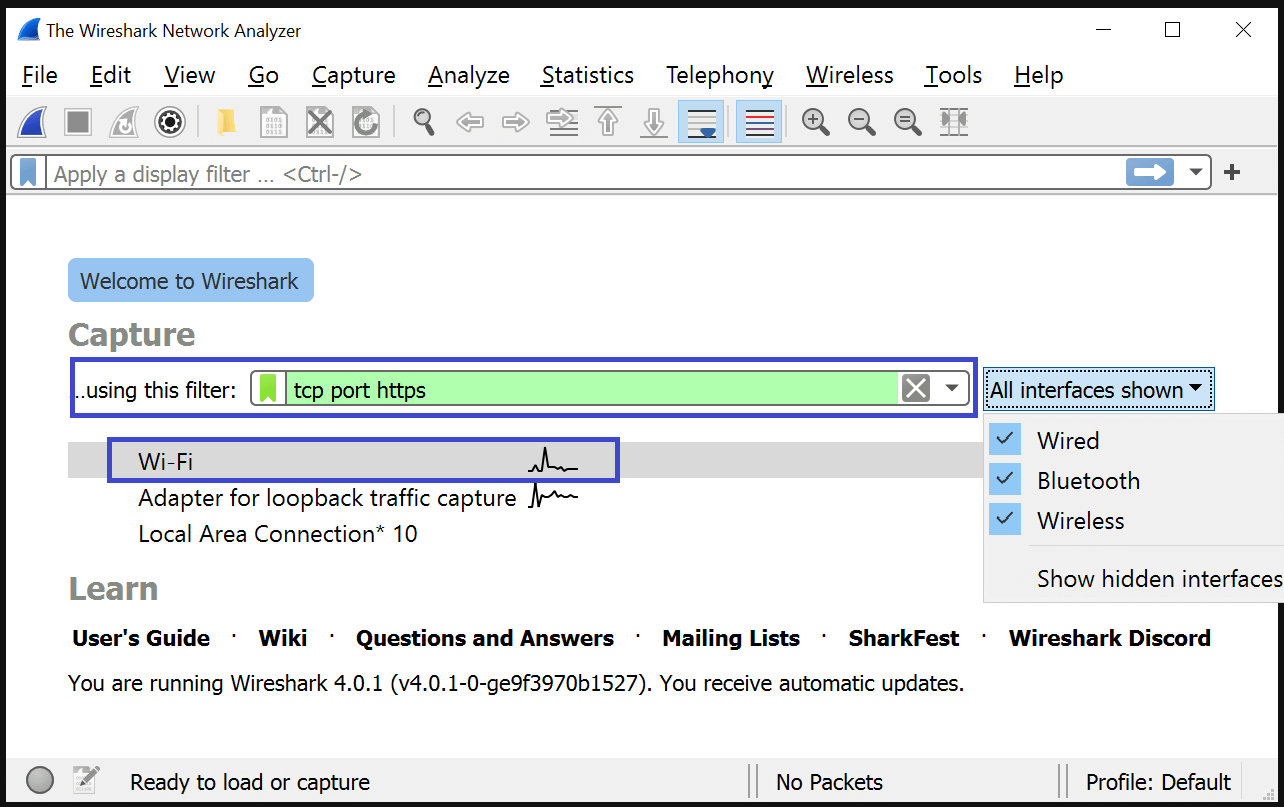
2. Start the Capture
To start a capture, click on Capture to open the capture menu. You can modify the capture properties by going to Options. You can specify filters, interfaces, output files, and other details. Once you have specified the options, click on Start to start the live capture.
3. Stop the Capture
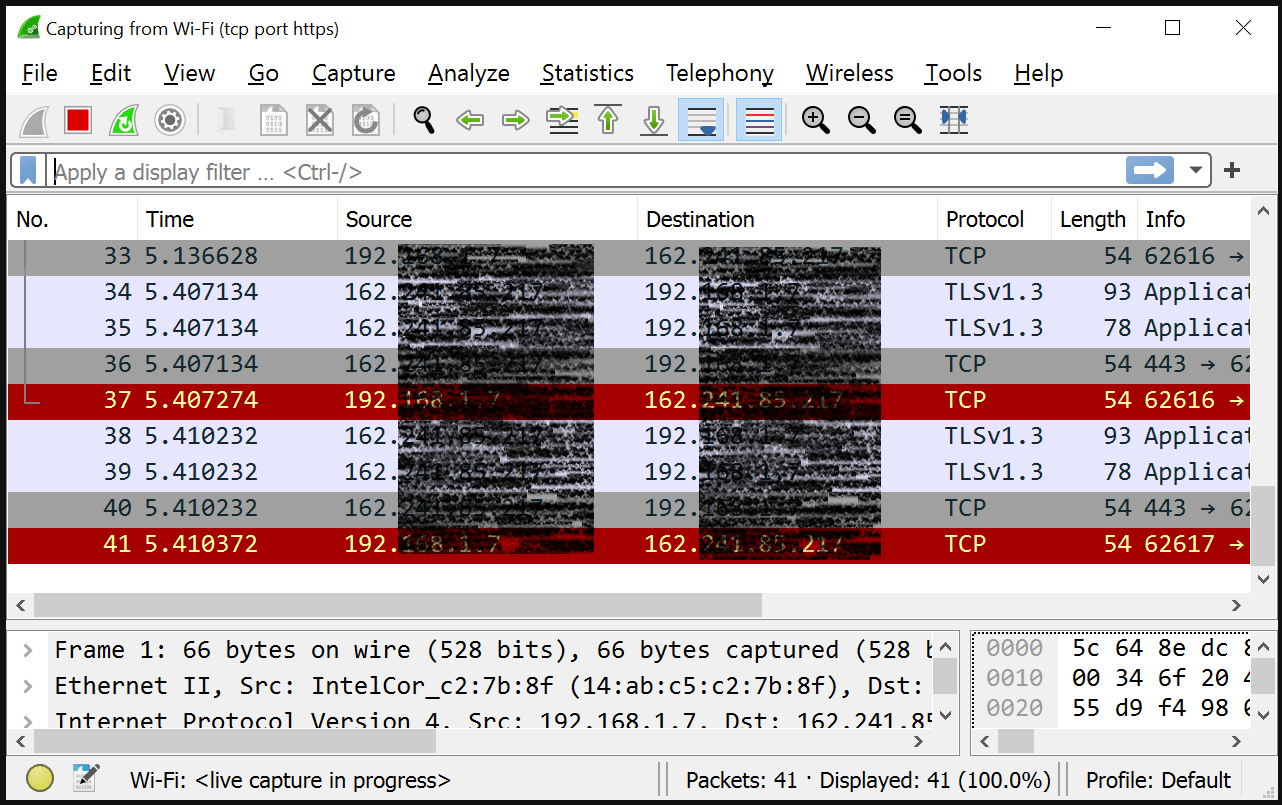
Once the capture starts the captured packets will be shown on the display area, you can wait for the time you want the capture to continue and then click on Stop (red square in menu bar) to stop the capture
Packet Analysis using Wireshark
For packet analysis, we can either start with a live capture or open a file that was previously captured using a tool like tcpdump. In the following section, we will cover how to use Wireshark to analyze packets from a saved capture or a live capture.
About tcpdump
tcpdump is a command line tool that allows you to capture network packets going through the system. It requires elevated permissions so on your linux system you either run it as a root or use sudo privileges,
tcpdump command provides multiple options to modify / specify the packets you want to capture based on interface, protocols, ports, source ip/host, and also write the output to a file,
We can simply run tcpdump command with -w flag will capture all the packets which we can later filter on wireshark as explained in following sections
tcpdump -w dump.pcap OR
we can specify some flags to our command to limit the size of our capture
tcpdump -nq -s 0 -i <interface> -w /tmp/dump.pcap`date +%H%M%d%m%s`
`date +%H%M%d%m%s` – automatically adds a timestamp to your capture file so you can run this command repeatedly and generate a unique file name with time stamp.
We can further limit our packet capture using flags like src , dst , port You can read more about tcpdump here
Using Wireshark for SIP Troubleshooting
Method 1
Opening a saved capture in Wireshark
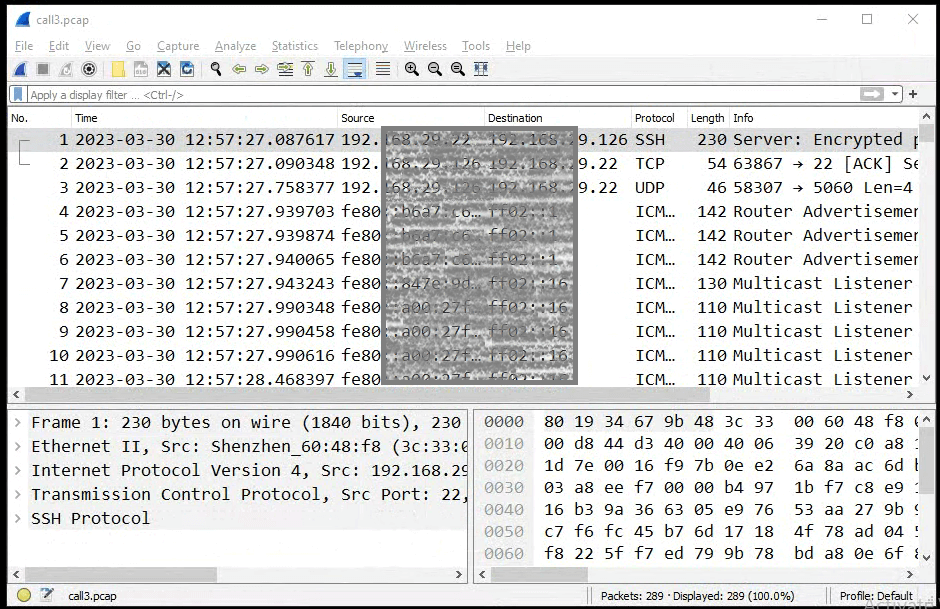
Open the captured traces in Wireshark
For this you can
- Go to File Menu –> Open
- Choose the file
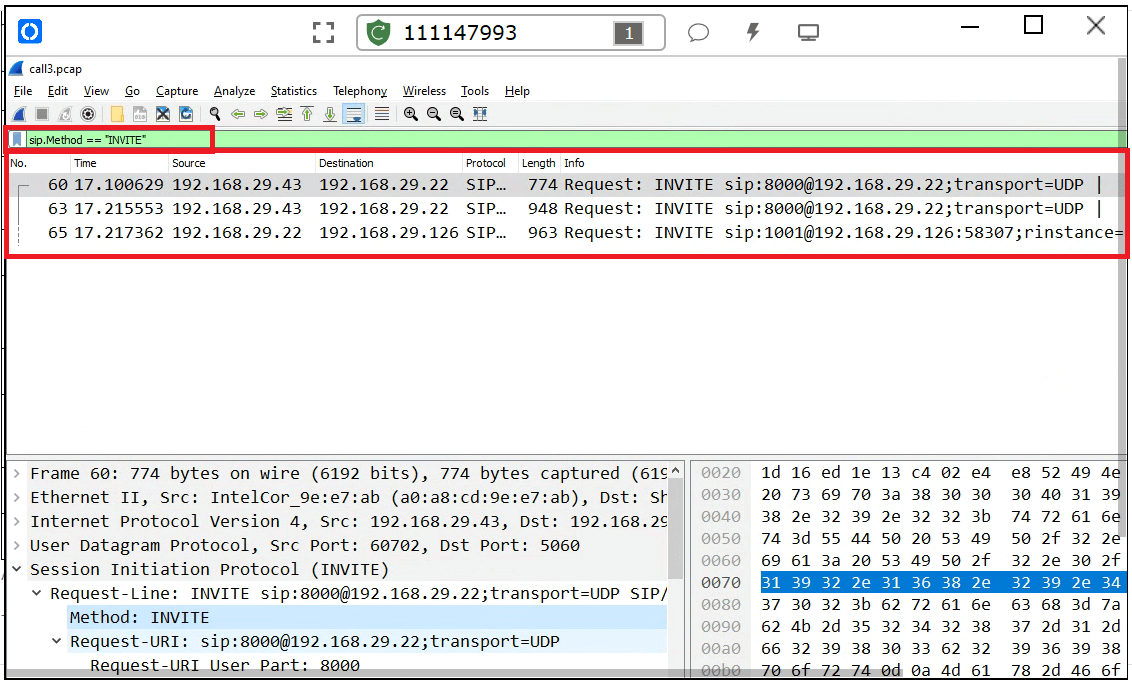
Filter for SIP INVITE
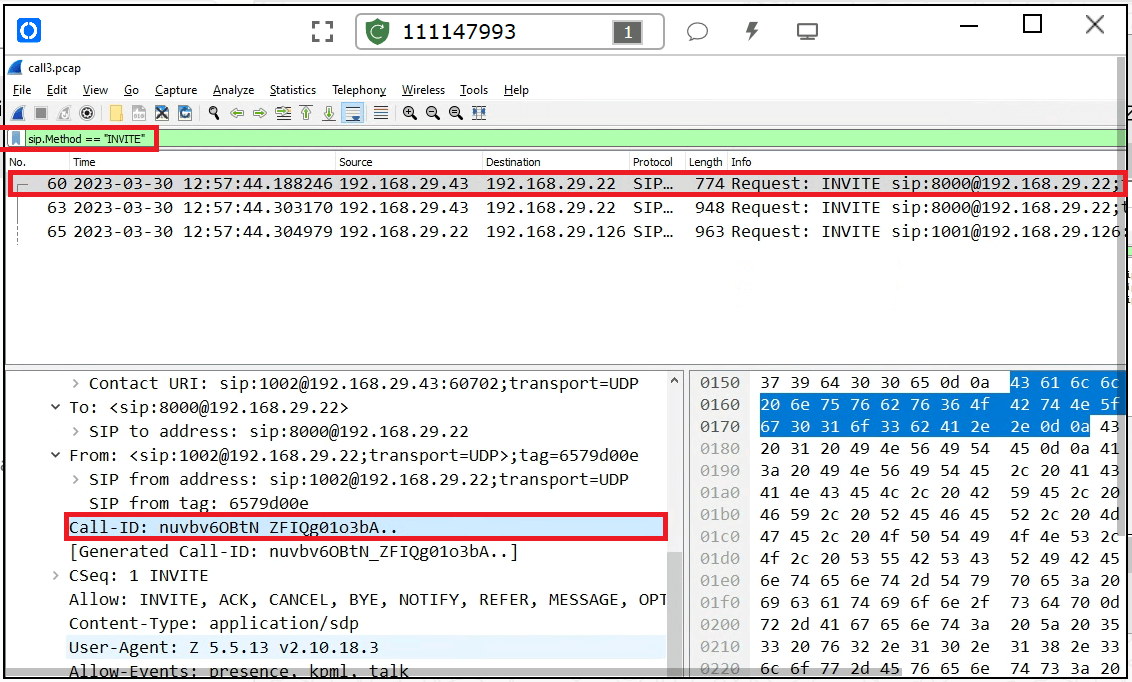
Once the traces are displayed, you can apply a simple sip filter to display all the sip invite packets
sip.Method == "INVITE"
It will display all the SIP INVITE messages, as we know SIP INVITE is the first message in the SIP CALL FlOW so this practically lists the INVITES packets for all the calls in the trace
Some of the other filters that you can use:
sip: This filters out all the SIP packets.sip.Call-ID=="": This filter out all SIP dialogs that have the mentioned call-id.frame contains "": This filters out all the packets that have mentioned string in them.ip.addr eq: This filters all the packets that come from or are sent to the mentioned IP.udp.port == 5060: This filters all the packets that come from or are sent to the mentioned port.
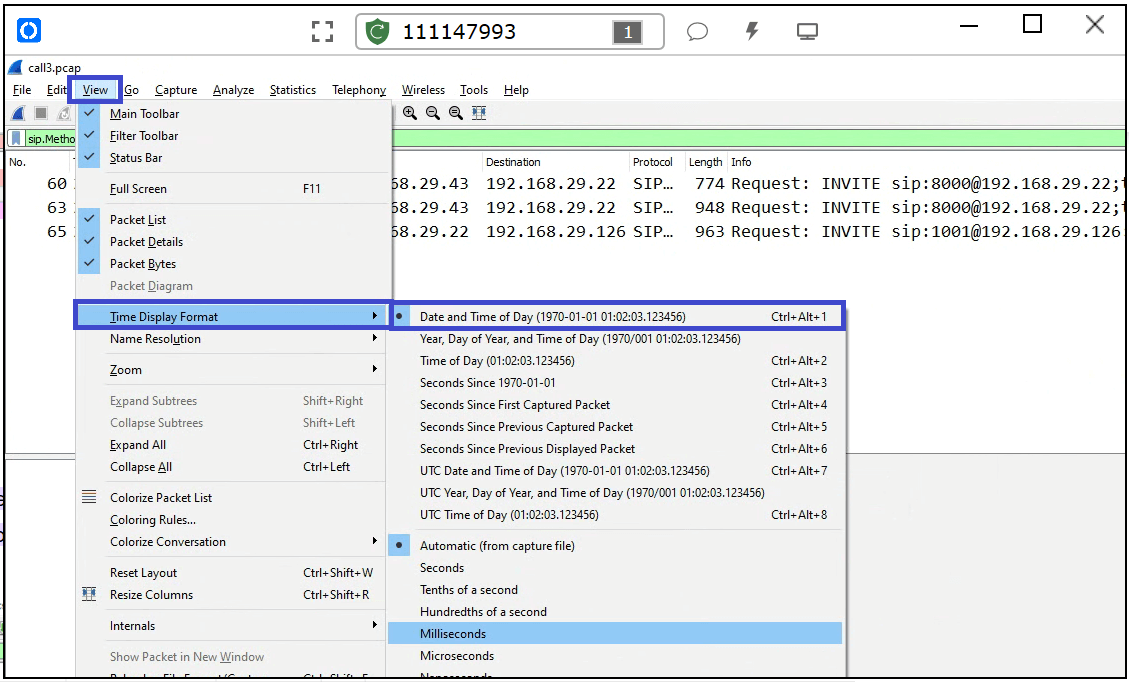
Wireshark Time and Date Display Format
You can also change the view options to display the date and time as the actual date and time of the packets captured. This will help you identify the actual call for which you want to analyze the packets.
Identify the call for which you want to analyze the packets
Now you can select particular call for which you want to see the SIP CALL FLOW
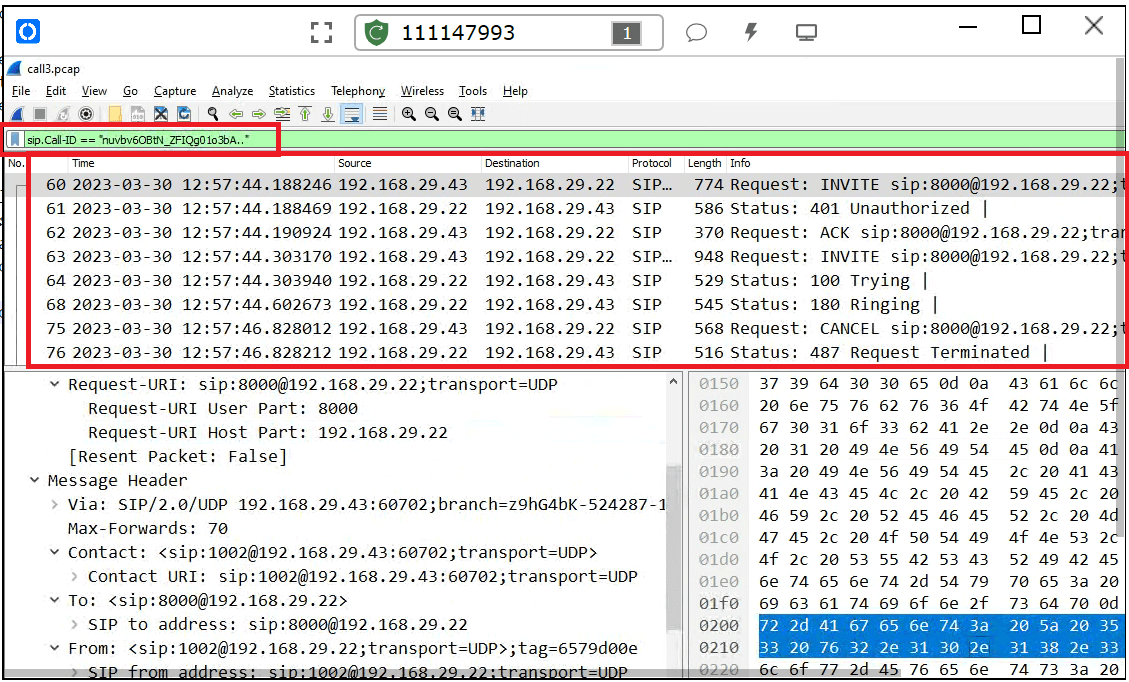
In the details box, drill down the toggled values and find the the SIP CALL ID for your call
Filter the packets for the call id
This will show you the all the packets for that specific call id in the capture trace
Now you can further debug for the SIP Message that you feel is the cause of the issue you are troubleshooting
For example in our case we can see that this call ended as 487 Request Terminated, We can see before 487 message, SIP CANCEL was initiated from .43 ip, we can click on this SIP packet and further debug if needed
Method 2
This method uses the predefined option available on Wireshark to automatically filter all the sip calls, this can be useful in cases where you have limited packets capture for very few calls, or the issues is happening with most calls
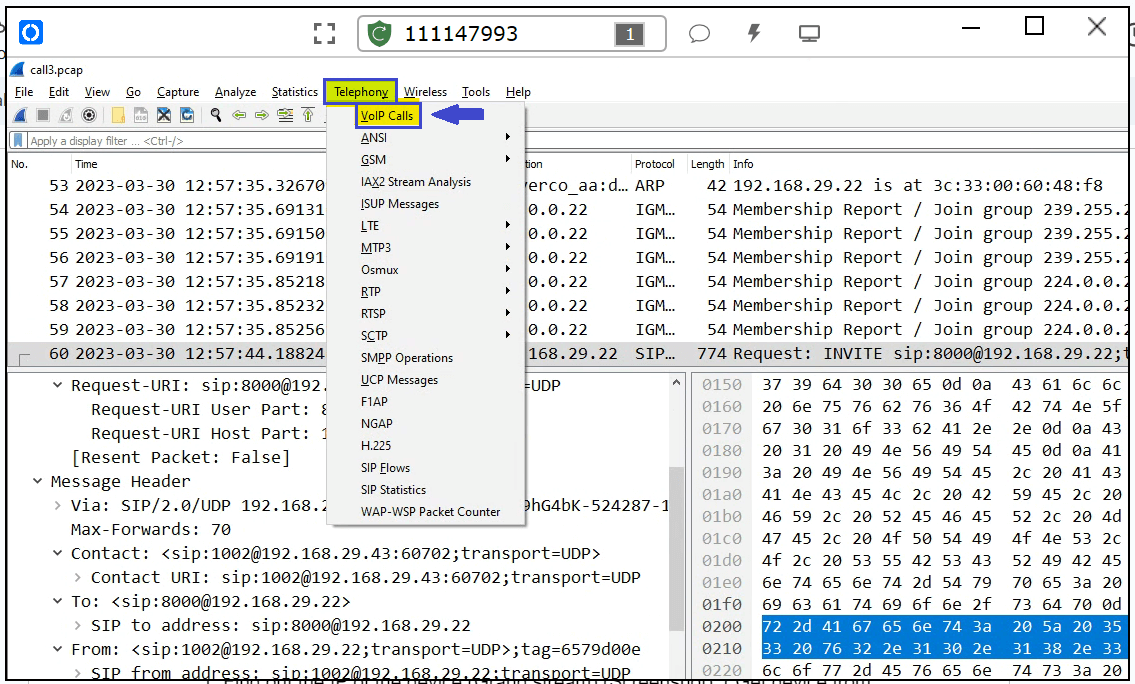
Open VoIP Calls Menu
In Wireshark under the Telephony menu section, there is an option VoIP Calls and this can be used to look at the SIP message flow between endpoints.
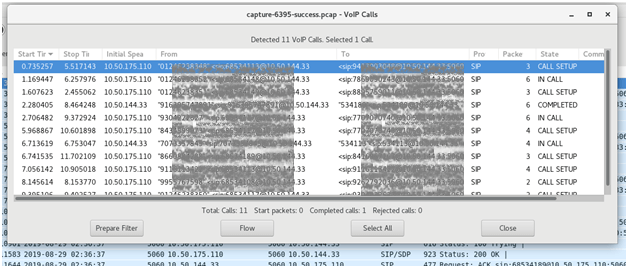
VoIP Calls Display
Once you click on VoIP calls Wireshark will automatically list all the VOIP calls in the file you have opened
Select a Call from the VoIP Calls List that you want to analyze and click on flow.
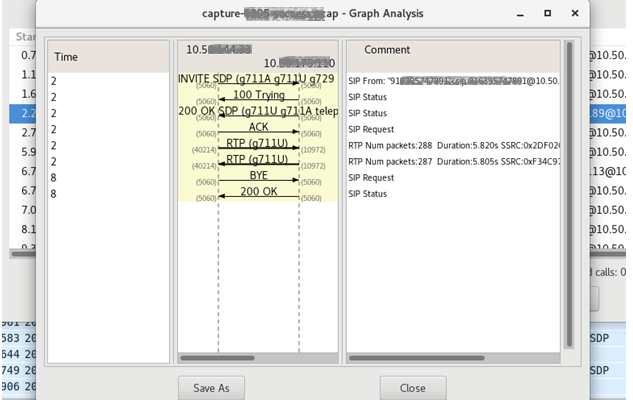
Prepare your SIP Call Graph
Select a Call from the VoIP Calls and click on flow.
You can also click on Prepare Filter, this will create a filter for the specific call and allow you to do detailed debugging
If your trace also had RTP captured you will also get an option to Play Streams where you can actually listen to the conversation that happed on SIP
Some Commonly used Filters for Wireshark
Following are some filter that we use while troubleshooting VOIP related issues.
| SNo | Filter | Description |
|---|---|---|
| 1 | sip | Displays all SIP packets |
| 2 | rtp | Displays all RTP packets |
| 3 | sip && rtp | Displays all SIP and RTP packets |
| 4 | ip.adr == <ip address> | Sets filter for any packets with <ip address> as source or destination. |
| 5 | ip.dst == <ip address> | Sets filter for packets with <ip address> as destination |
| 6 | ip.src == <ip address> | Sets filter for packets with <ip address> as source |
| 7 | http or dns | Sets a filter to display all https and dns |
| 8 | tcp.port==8080 | Sets filter for any tcp packet with 8080 as source or destination port |
| 9 | tcp.port in (80 443 8080) | Sets filter for all the ports in the bracket. |
| 10 | http.request | Display all HTTP GET requests |
| 11 | tcp contains traffic | Display all tcp packets containing string ‘traffic’, good when searching for a specific string or user ID. |
| 12 | !(arp or icmp or dns) | Marks out arp, icmp, dns packets |
| 13 | tcp.analysis.retransmission | Displays all retransmissions. Helps when tracking down slow application performance and packet loss. |
| 14 | SIP contains <number> – | To search a specific number, |
| 15 | ip.src==<ip address> && ip.dst==<ip address> | To find out packets which were transmiteed from source ip address and destination Ip address |
FAQ
SIP is the signalling protocol using in VOIP, Wireshark is packet capture tool that allows us to capture network traffic, Since SIP or VOIP our voice is tranmitted like data packets, wireshark can capture and analyze these packets.
To filter SIP packets you an simple create a filter “sip”
For displaying both SIP and RTP use “sip || rtp”
For specific SIP methods:
INVITE requests: sip.Method == "INVITE"
REGISTER requests: sip.Method == "REGISTER"
BYE requests: sip.Method == "BYE"
SIP responses (e.g., 200 OK, 401 Unauthorized, 404 Not Found): sip.Status-Code == 200
Use the following filter ip.addr == 192.168.1.100 && sip
Use the following in the filter “rtp”.
To analyze audio, go to Telephony → RTP → RTP Streams, then select a stream and click Analyze. You can play back the audio to check for jitter, packet loss, or distortion.
Use rtp filter to see if RTP is flowing in both directions. In case you find RTP is only flowing one way then check for NAT issues, firewall issues, or codec mismatches
Navigate to Telephony → VoIP Calls to see a list of captured calls. Click Flow Sequence to visualize the SIP handshake, including INVITE, TRYING, RINGING, OK, and BYE messages.
Use sip.Method == "REGISTER" to filter for register requests, and if client is sending the requests.
Look for 401 Unauthorized or 403 Forbidden responses indicating authentication failure and corrent authentication parameters if found failing
Conclusion
In conclusion, Wireshark is a powerful tool that can be used to troubleshoot SIP problems. By capturing SIP traffic, you can identify and troubleshoot problems with SIP signaling, which is the process of setting up and managing VoIP calls. If you are experiencing problems with your VoIP system, we recommend using Wireshark to troubleshoot the issue. Wireshark can be a valuable tool for identifying and resolving SIP problems.
….
…..
Author
Pravin Tewari
Senior Manager, Application and Cloud Support
Pravin is a visionary professional with over 11 years of experience in Technical Support, Cloud Infrastructure Management, and Customer Experience. He has hands-on experience in working across the lifecycle of project delivery and deployment, solution consulting, and support. He has deep experience in managing cloud deployments and implementing DevOps tools for automation to provide better uptime. Pravin has successfully led large product & cloud support teams, and coached & mentored a high-performing team that delivers high-quality service to customers.