
With Linux distributions acting as servers for majority of web applications and Software as a Service, Infrastructure as a Service, etc. platforms, managing Load on the installations is one of the most important tasks for system admins, SRE’s and technical support teams
How is Load measured
In linux load is measured in two dimensions
CPU Load : it is a measurement of CPU over / under utilization,
Load Average : it is the average system load over a period of time.
Lets see this in detail
Load Average can be found by running top command or uptime command as shown below

There are many misconceptions / doubts on how we understand the Load Average as shown in Linux
- What is load average as shown in top command ?
- What this values represent ?
- When it will be high, when low ?
- When to consider it as critical ?
- In which scenarios it can increase ?
In this Blog we will talk about the answers of all these .
What are these three values shown in above image ?
The three numbers represent averages over progressively longer periods of time (one, five, and fifteen-minute averages) and that lower numbers are better. Higher numbers represent a problem or an overloaded machine .
Now before getting into what is good value, what is bad value , what are the reasons which can affect these values , We will understand these on a machine with one single-core processor.
The traffic analogy
A single-core CPU is like a single lane of traffic. Imagine you are a bridge operator … sometimes your bridge is so busy there are cars lined up to cross. You want to let folks know how traffic is moving on your bridge. A decent metric would be how many cars are waiting at a particular time. If no cars are waiting, incoming drivers know they can drive across right away. If cars are backed up, drivers know they’re in for delays.
So, Bridge Operator, what numbering system are you going to use? How about:
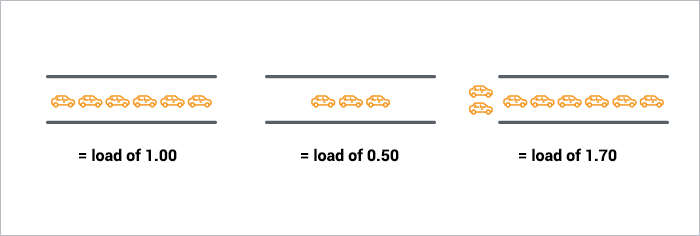
- 0.00 means there’s no traffic on the bridge at all. In fact, between 0.00 and 1.00 means there’s no hold up, and an arriving car will just go right on.
- 1.00 means the bridge is exactly at capacity. All is still good, but if traffic gets a little heavier, things are going to slow down.
- over 1.00 means there’s holdup. How much? Well, 2.00 means that there are two lanes worth of cars total — one lane’s worth on the bridge, and one lane’s worth waiting. 3.00 means there are three lanes worth total — one lane’s worth on the bridge, and two lanes’ worth waiting. Etc.
Like the bridge operator, you’d like your cars/processes to never be waiting. So, your CPU load should ideally stay below 1.00. Also, like the bridge operator, you are still ok if you get some temporary spikes above 1.00 … but when you’re consistently above 1.00, you need to worry.
So you’re saying the ideal load is 1.00?
Well, not exactly. The problem with a load of 1.00 is that you have no headroom. In practice, many sysadmins will draw a line at 0.70:
But now a days we many multiple cores systems or multiple processors system .
Got a quad-processor system? It’s still healthy with a load of 3.00.
On a multi-processor system, the load is relative to the number of processor cores available. The “100% utilization” mark is 1.00 on a single-core system, 2.00, on a dual-core, 4.00 on a quad-core, etc.
If we go back to the bridge analogy, the “1.00” really means “one lane’s worth of traffic”. On a one-lane bridge, that means it’s filled up. On a two-lane bridge, a load of 1.00 means it’s at 50% capacity — only one lane is full, so there’s another whole lane that can be filled.
Same with CPUs: a load of 1.00 is 100% CPU utilization on a single-core box. On a dual-core box, a load of 2.00 is 100% CPU utilization.
Which leads us to two new Rules of Thumb:
- The “number of cores = max load” Rule of Thumb: on a multicore system, your load should not exceed the number of cores available.
- The “cores is cores” Rule of Thumb: How the cores are spread out over CPUs doesn’t matter. Two quad-cores == four dual-cores == eight single-cores. It’s all eight cores for these purposes.
What if the load goes beyond the number of cores
But What to extract from here that if load is going beyond number of Cores , Are we in crunch of Cores ?
Well Not exactly , For this we need to further debug or analyse TOP command data to come to a conclusion.
Impact of User Process and System Process

In above output , This coloured part shows CPU used by
- user process(us) and
- system process(sy) .
Now if these values are around 99-100%, it means there is crunch of cpu cores on your system or some process is consuming more CPU . So, in this case either increase cores or optimize you application which is consuming more CPU .
Now let’s take another scenario :
Impact of disk read / write speed

In above image , coloured parts shows amount of time CPU is waiting in doing Input/Output(I/O) . So say if this values is going above say 80% ,then also load average on server will increase . It means either
- you disk read/write speed is slow or
- your applications is reading/writing too much on your system beyond system capability .
In this case either diagnose your hard disk read/write speed or check why your application is reading/writing so much .
Now let’s take one more scenario :
Impact of softirq’s

If values Above coloured output goes beyond certain limit , it means softirq(si) are consuming cpu. It can be due to network/disk interrupts . Either they are not getting enough CPU or there is some misconfiguration in you ethernet ports due to which interrupts are not able to handle packets receiving or transmitting . These types of problem occurs more on VM environment rather than physical machine.
Now , Lest take one last scenario :
Impact of CPU Steal Time

This above part will help you in case of Virtual Machine Environment .
If %st increases to certain limit say it is remaining more than 50% , it means that you are getting half of CPU time from base machine and someone else is consuming you CPU time as you may be on shared CPU infra . In above case also Load can increase .
Summary
I hope it covers all major scenarios in which load average can increase . Understanding different parameters from the output for top command can help you understand the performance of your linux server better.
Stay tuned to know more about further analyzing and answering questions like how to check read/write speed, how to check which application is consuming more CPU and how to check which interrupts are causing problem.
Refrences : https://scoutapm.com/blog/understanding-load-averages
See Original Posts at hello-worlds
and at medium
..
..
Author
Sahil Aggarwal
Senior Software Engineer 3/Tech Lead at Ameyo
I am a Tech Professional working in IT industry from 10 years . I have worked on many technologies like java, databases, linux, netrowking, security and lot more . I generally believe in taking outside-in approach to any new product you are looking for . This behaviour helped me lot in debugging issues of new products or even issues of any other system throughout by journey. I like to write tech blogs and I have my personal blog sites also, I write on medium and dzone also . I am very adaptive working between Individual Contributor and as a Leader/Manager. Apart from technology, I like eating fast and junk food . I also like to listen and write shyari.